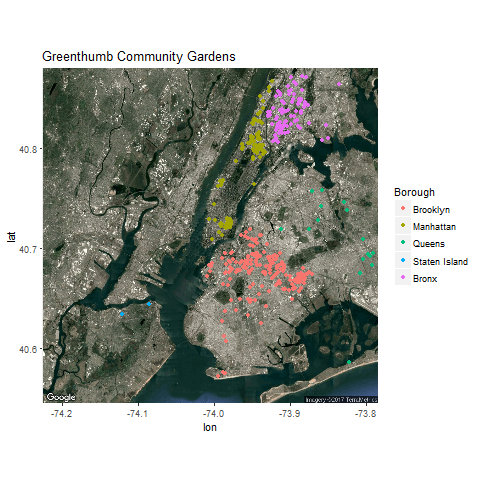
Mapping 400 of NYC's Greenthumb Community Gardens and styling them according to what borough they are in.
Script (R language):
## load packages, including ggmap
library(ggplot2)
library(ggmap)
## other spatial packages include: "rgdal", "rgeos", "maptools", "tmap", "leaflet"
## obtain a basemap from Google using ggmap's get_map function
nyc <- get_map(location = "New York City", maptype = "satellite", zoom = 11)
ggmap(nyc)
## read in the data
community_gardens <- read.csv("C:/databin/NYC_Greenthumb_Community_Gardens.csv")
## taking a look at the "Boro" column to create a matching vector to label it in plotting function
summary(community_gardens$Boro)
## creating a new vector of strings to act as labels in plotting function
boroughs <- c("Brooklyn", "Manhattan", "Queens", "Staten Island", "Bronx")
## run tiff("filename") simultaneously with the plotting function to save to an image - other functions include pdf() and png()
## create the base layer, plot the points with colors differentiated by value in "Boro" column, rename color labels on the legend, give it a title
## run dev.off() to make R stop using your computer's graphics device
tiff("community_gardens_image.tiff", res = 600, compression = "lzw", height=5, width=5, units="in")
ggmap(nyc) +
geom_point(data = community_gardens, mapping = aes(x = Longitude, y = Latitude, color = factor(Boro, labels = boroughs))) + labs(color = "Borough") +
ggtitle("Greenthumb Community Gardens")
dev.off()
## data file obtained from: https://data.cityofnewyork.us/…/NYC-Greenthumb-Co…/ajxm-kzmj
## more info on NYC greenthumb gardens here: http://www.greenthumbnyc.org/